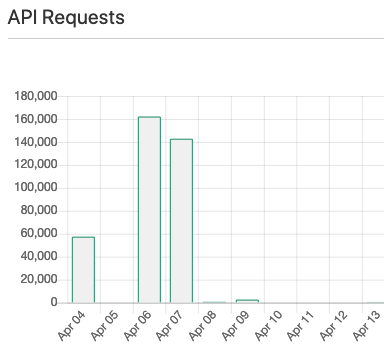
The Viewer API allows software developers to create their own applications on top of the Sketchfab platform. To learn more about it, visit our API Developers community.
About Me
Software Engineer on maps
My name is Xavier Fischer and I am a software engineer hailing from in Aix-en-Provence in France. My passion is helping the community to develop custom GIS software (Geographical Information Systems), which I have been doing for nearly a decade now. I develop software tools using primarily Microsoft .Net and C#, which have been my companions during my journey to becoming a Microsoft Certified Professional Developer in early 2010, and SQL Server Database Developer in 2012.
Cartography and data bring challenges: maps are data until you actually see them, so all the code is written “blind”. You must clear your assumptions, as there is always a new case like nothing that came before it, and you must build resilient and efficient code: maps data are huge.
To develop software tools for processing mapping data requires several different sets of skills in software engineering and also subjects like mathematics and computer graphics. As there is no single standard for mapping data, there is no singular approach to how to process them. As such, developing DEM Net is a constant evolutionary journey where our data and services are constantly evolving. This has resulted in our user base increasing with each new evolution of DEM Net features and we are in a position right now where we serve thousands of users each month.
Creative Coder
I also call myself “Creative Coder”, co-building with my spouse, who is a contemporary dance professor, a dance/arts workshops for children using live mapping and interactivity (see Atelier Danse Arts Numeriques on Vimeo and Projet “Bouge ton oeuvre”), and light/music shows for theatre.
Open-Source Contributor
I have built many pet projects hidden from the world on my private computer, before online repos even existed. Those projects are now sleeping on a hard drive in my basement. Open source means a safe place to hold the source code, easier cross-computer workflows, sharing and collaboration, and invites commitment and code quality. I want to build something others (including me) can run, something clean, something inspiring.
I had the opportunity to build developer tools for myself in my career. I always find it useful to share these bits with everyone, in case someone needs a tool and can’t afford (for time or ability) to code it.
I have contributed to GeoJSON.Net, providing bits for its SQL Server and became co-owner of the repository.
3D Background
I have always been attracted to 3D. I built my first 3D program at 17 in Pascal when there were no 3D frameworks. It was a space field with flying squares and all 3D world/screen conversions were hand-coded.
Later on, I went to XNA game engine and built some visuals for a contemporary dance exhibition with Kinect. I moved then to C++ with OpenFrameworks, a great tool for building 2D/3D artistic shows.
 Dance/Arts Workshop at Vasarely Foundation, Aix-en-Provence by Association Al Reves and Xavier Fischer – child-dynamic-evolving projection mapping on floor.
I know 3D from the coding side (meshes, vertices, normals, matrices), creating procedural models from code. So even if I know Blender and MeshLab, I never use them. I’m building code to produce 3D models.
History of the Project
Some Numbers
- Web site https://elevationapi.com started in September 2019
- 1.6 TB of DEM data hosted at elevationapi.com
- 22,000 models generated (250 GB)
- People from 160 countries have tested the API so far
- 50,000 lines of code
- Sketchfab: 143 followers, 25K views, 700+ likes, 60M triangles, 100 models (and counting!)
Context: Landscapes are beautiful, scales are hard to feel
 Santiago de Chile with the Cerro Plomo barely visible (Source)
I had the chance to visit Santiago de Chile a few times. One day when there was nice weather, I traveled from the southwest heading northeast. Far away, I noticed there was a strange cloud—until I realized the low range sky was in fact a massive mountain, the Cerro Plomo (5500 meters), surrounding Santiago (500 meters). 5000 meters difference in a 65 km range. (Some airplanes need to circle before gaining enough altitude to cross the Andes!). I wanted to share that experience in an understandable way. A picture is good, a plot is good, a 3D model is great, and even better if you include a well-known object (such as the Eiffel Tower) at scale. This is the core of the project, sharing experience. That’s why I frequently publish models of places I find astonishing.
 Elevation profile from Santiago to El Plomo. Scales are relative, see elevation profile live here.
I have always been passionate about mountains, summits. There’s no better 3D experience than facing a big mountain and feeling this massive relief just in front of you. I always wanted to know how elevation profiles were made (like the Tour de France plots where you see the slopes along the way).
I looked on GitHub in my tech field (C#) and found that there was… nothing. This was the first time something wasn’t already done, it just didn’t exist at the time in .Net, not free and open source.
I started to learn what Digital Elevation Models (DEM) were, how the data was encoded, and found that OpenTopography, a great resource for topography data, was publishing 3 global datasets with direct download links.
I had found my data source.
Learn and break the rules
There was a white page on GitHub. No one at the time was doing this in C#, at least not open source. I wanted to lay the first stone: I spent all evenings doing this. How do I read GeoTiffs? How do I compute normal maps ? How do I read fast? What is glTF ? etc…
I wanted to build more than a software or a tutorial of me using expensive software, I wanted to publish a library for easy DEM integration in any .Net software, for non-cartographers.
I wanted to compete with the best services available in terms of data accuracy and performance. I felt awkward that you’d have to pay to get elevation data that has been read from public data files.
I wanted instant results with cross-platform open source, and no manual editing. Period.
I knew where to get the data, .Net Core 2.2 was mature enough, so I jumped in.
Early steps
I created Dem.Net Elevation API a few days later, in January 2017, and the first tests were conclusive: I was able to get location elevations, profile lines along a path. I compared the results I had with results from Google Elevation API and I was proud to see that I had good (if not great) results!
One thing is really wrong with many Elevation APIs: they tend to cut out peaks and coves when they simplify the result, because they just blindly resample the data. This is something I didn’t advertise much, but DEM Net Elevation API produces simplified results of elevation profiles while preserving topology aspect, using the Ramer-Douglas-Peucker algorithm.
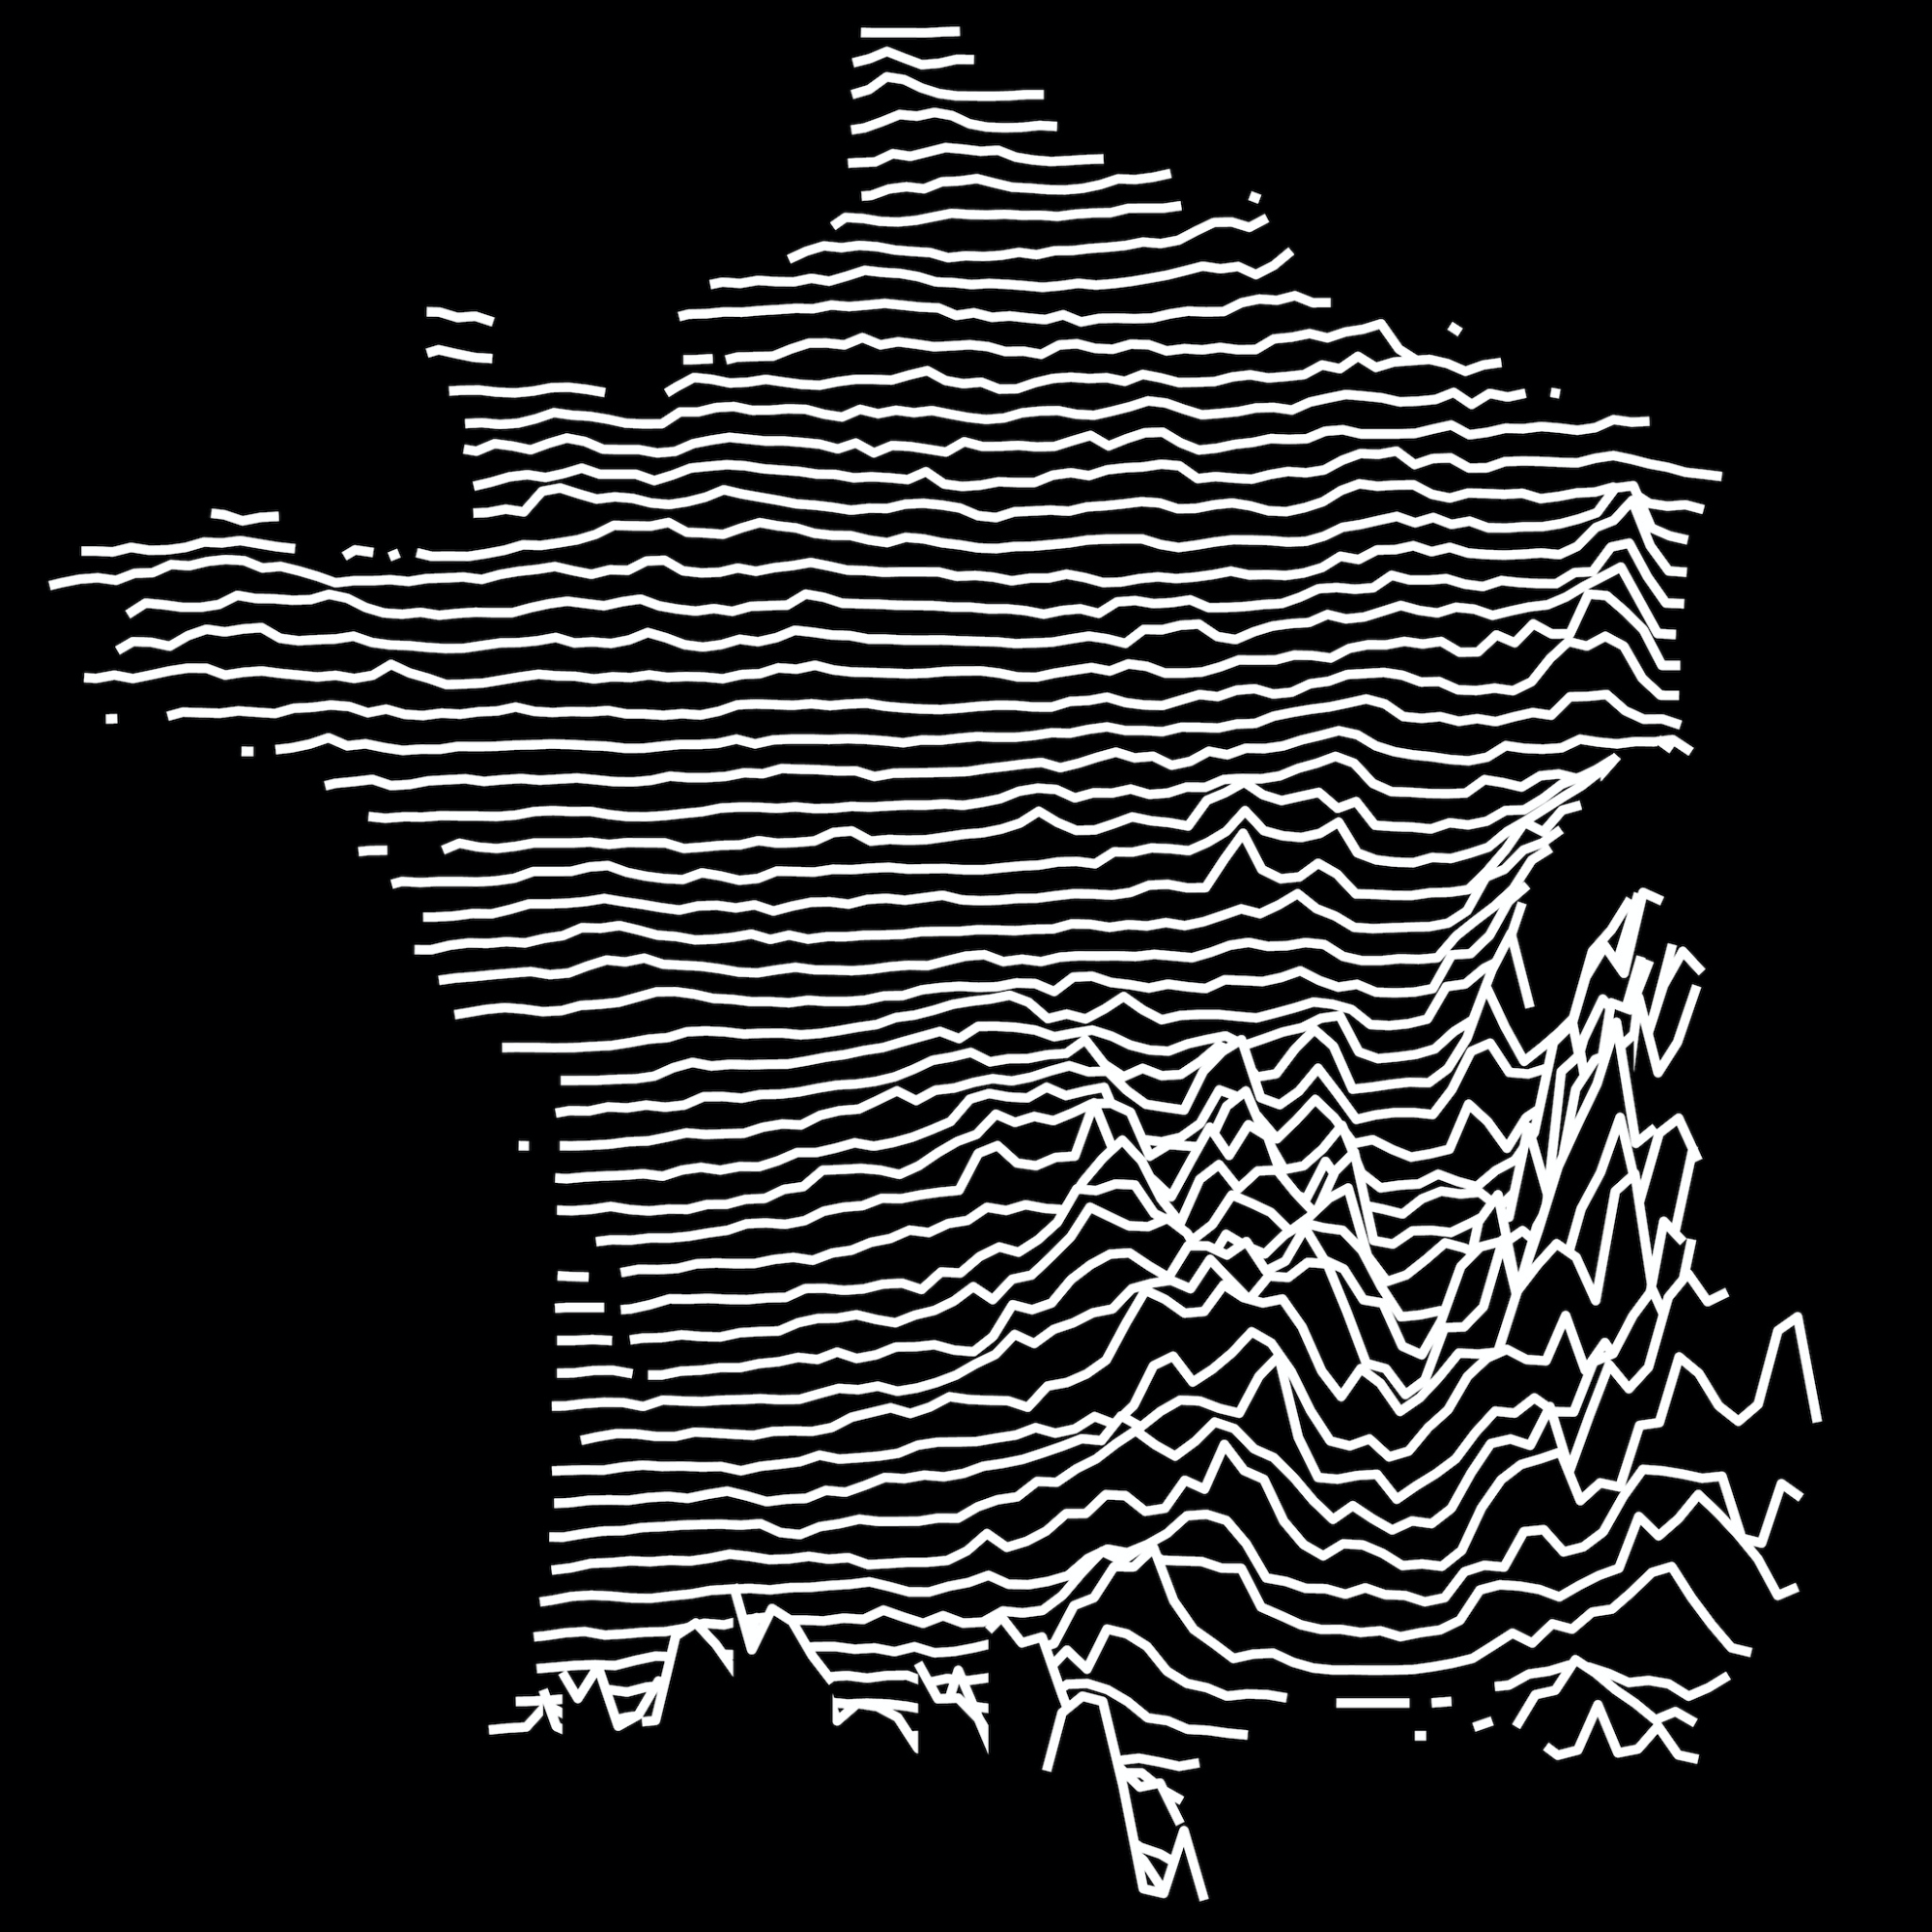
I left the project for a while and saw one day a nice picture on Twitter of Alaska drawn of pure horizontal lines. I wanted to reproduce that line plot anywhere in the world. Moreover, I saw on GitHub that the project gained traction with 60 visits/day (the API was “only” getting points and lines elevations from GeoTiff files). I realized that this was something that would benefit the community.
I wanted a seamless user experience. Many awesome tools require prior data download. And it’s very hard given a region to know which files are needed. I wanted this to be transparent for the API consumers. I updated the API to download DEM files automatically from OpenTopography (now also from NASA) in the background, given coordinates, bounding box, or GPX file.
I started experimenting with France by loading the outline shape to make cut-outs.
- Elevation profiles along the same longitudes from AW3D30 dataset
- “Joy Division” style print from AW3D30 dataset
It was still hard to “share” the beautiful pictures (it can be done now live here, by Andrei Kashcha). I knew about WebGL and this was a great opportunity to share those models. At the time they had to be pre-generated (see here) and were ThreeJS Javascript code generated from C# code.
Going 3D with glTF
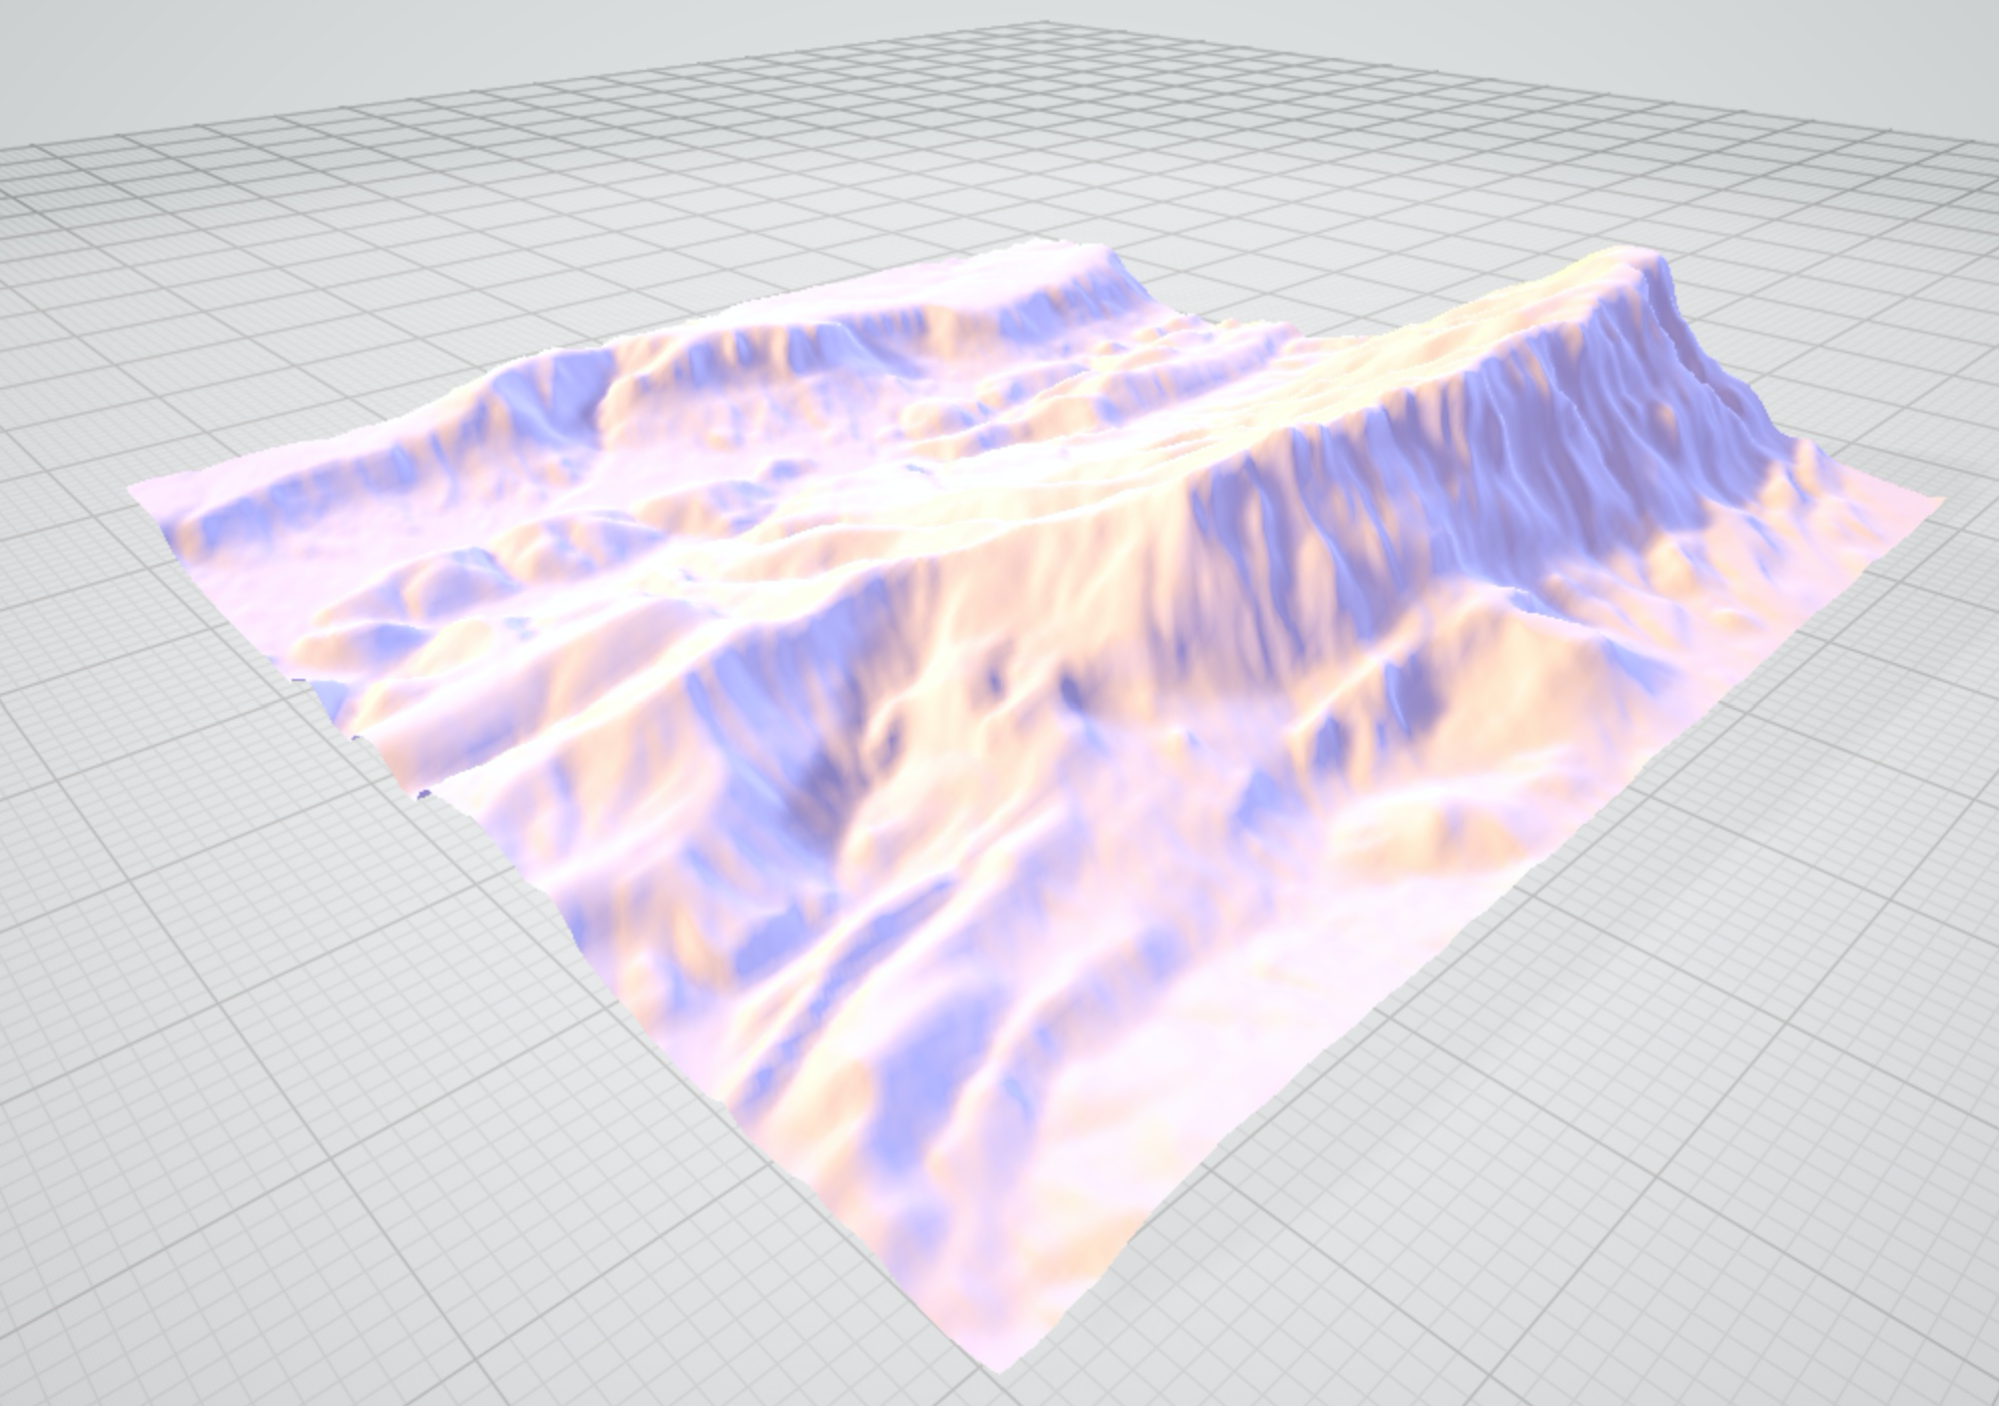
I asked myself: what 3D format should I use to standardize my output? And why not full triangle meshes for terrains instead of lines, why not go full 3D? At the time, the only open format supporting all 3D features with a C# implementation was the glTF format. It was natively supported by Windows 10 with the great 3D viewer app. I dug into KhronosGroup glTF repos and built a glTF pipeline for the API, allowing 3D model generation, still untextured.
I added some colors, played with Z exaggeration, and a global bathymetry dataset
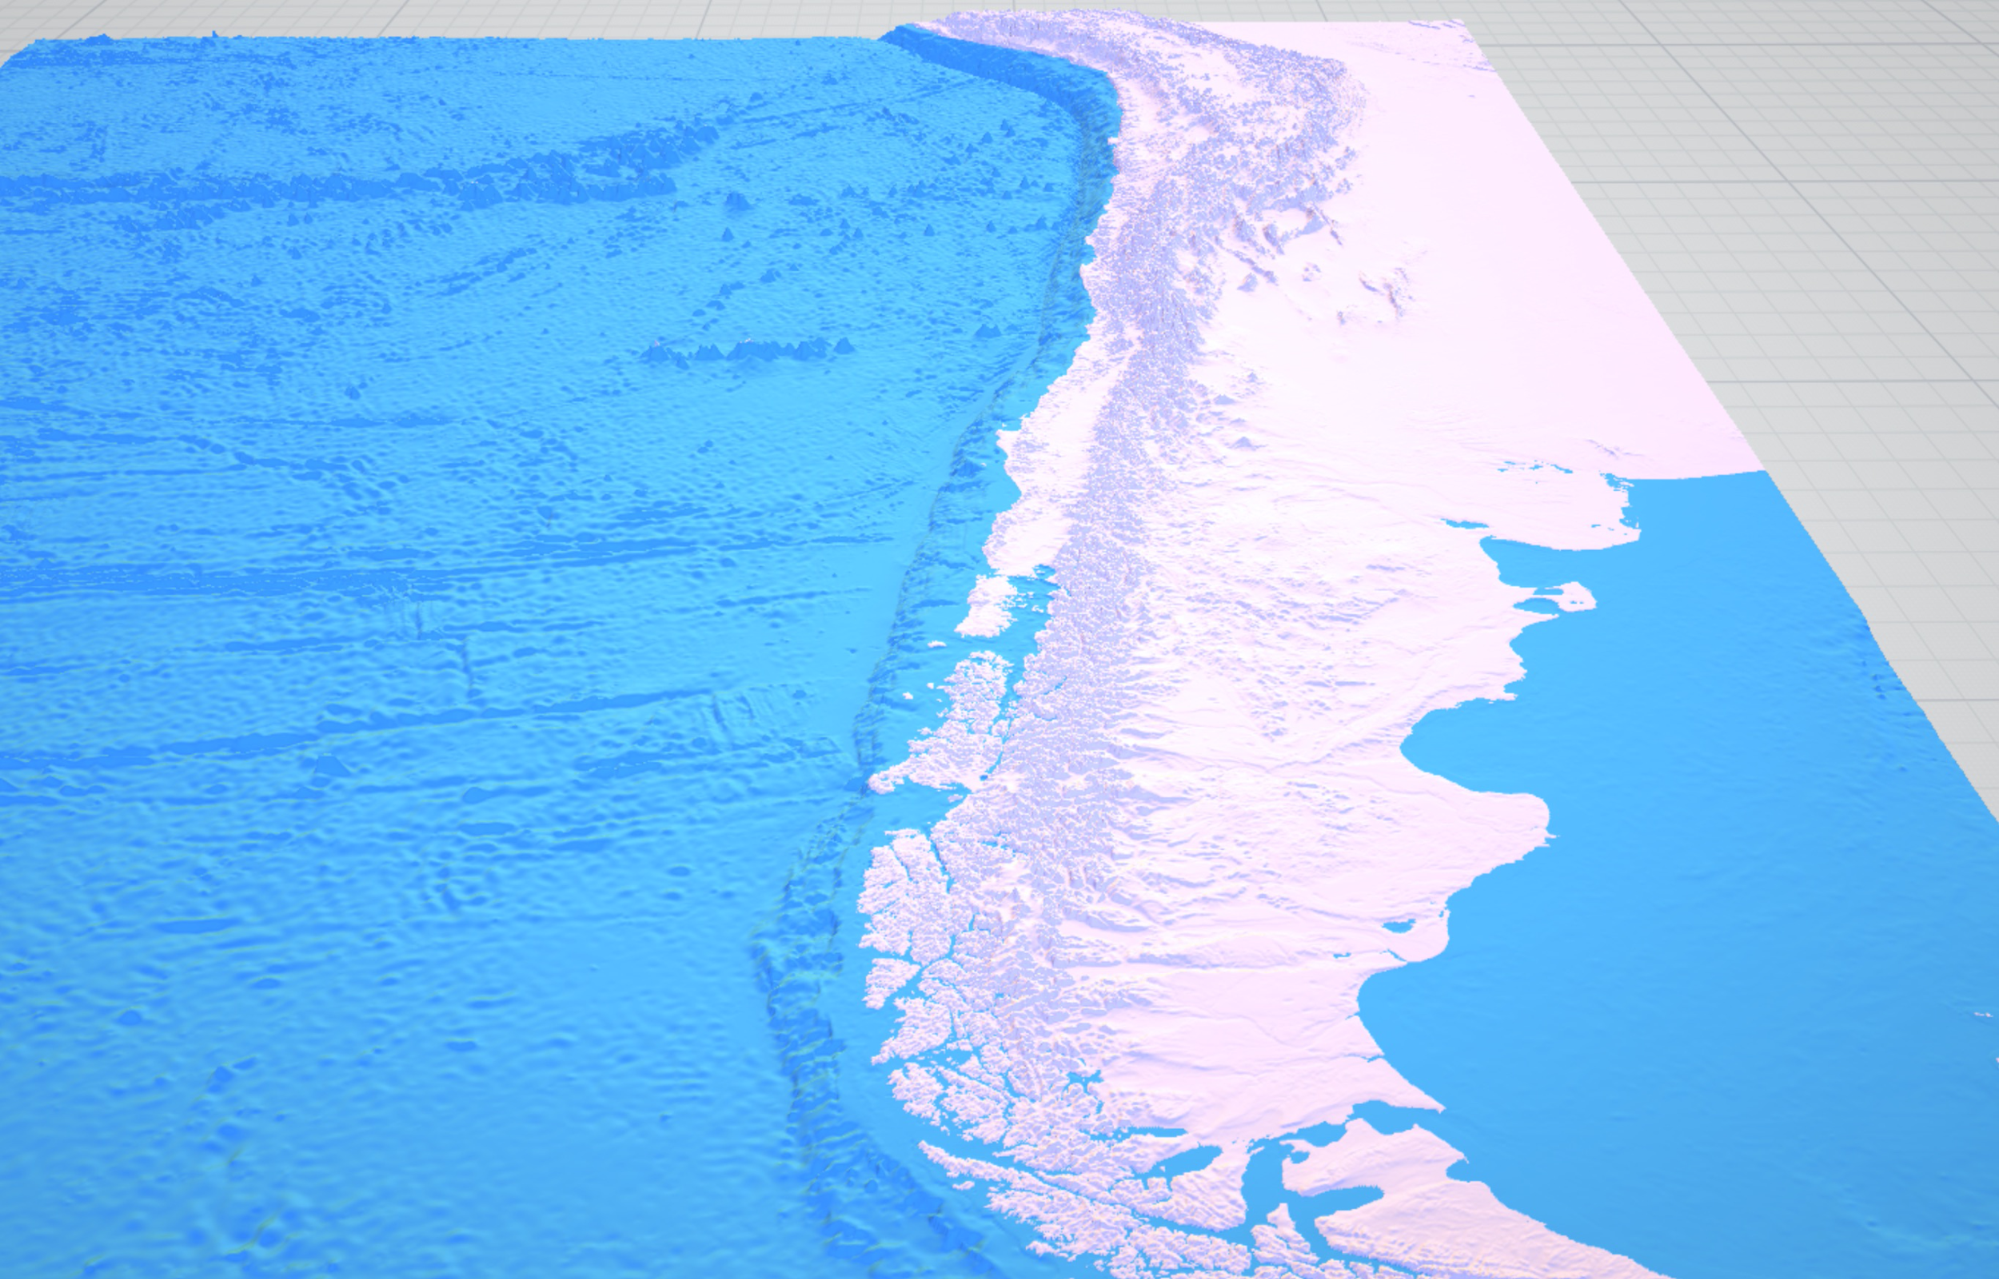 Chile-Peru trench, South America, ETOPO1 dataset – this is the dataset used in every physical low scale map
Each new area processed was giving me the drive to explore every region I knew with high relief amplitudes, and discovered incredible places:
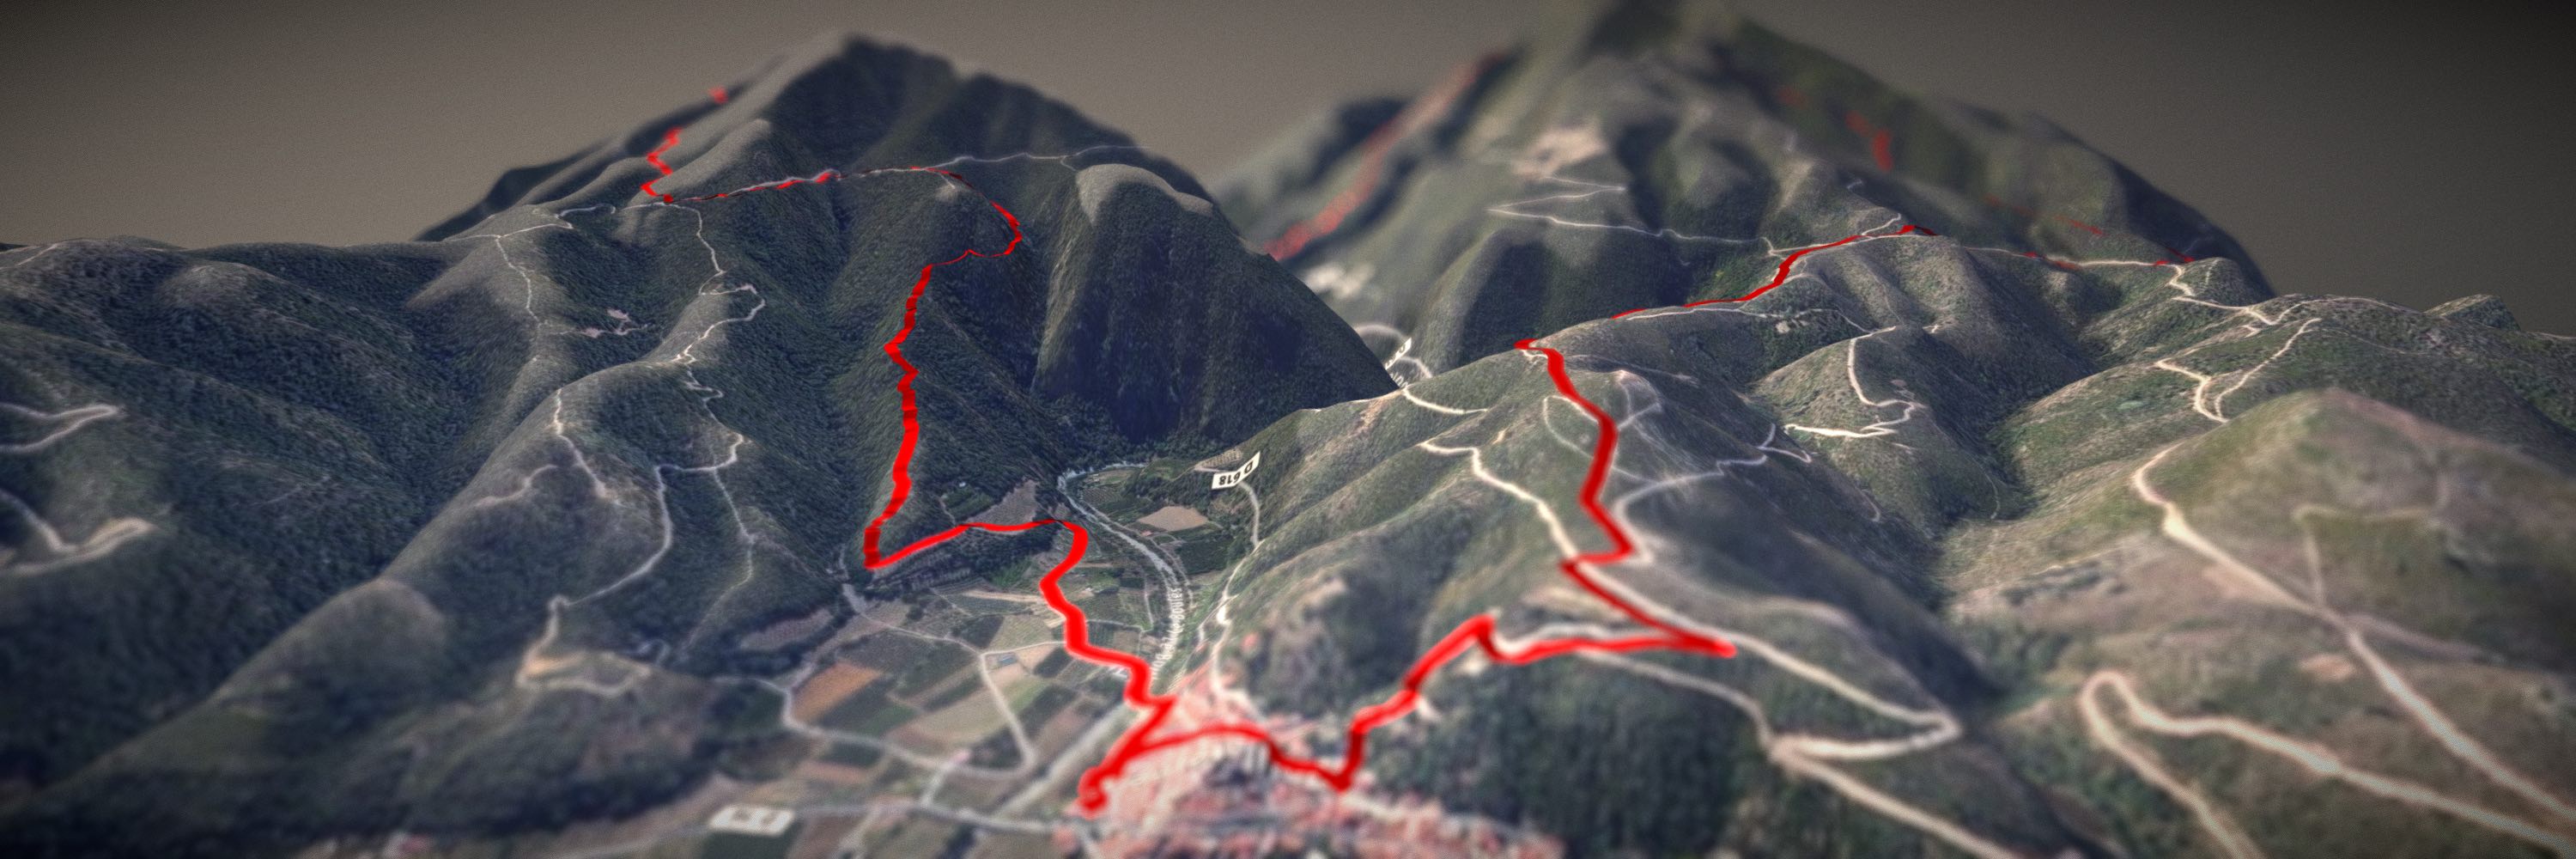
I had 3D terrains and a good line elevation algorithm, so I experienced GPX tracks integration onto models.
There was the classic way (draw the track onto the model texture, as an image), and the 3D way (the track is a 3D model by itself).
This was hard: if the track was a line, it would not be visible—it had to be a plane, a flume, of fixed width. I did the triangulation using 3D math and elevated the track a few meters above the terrain.
First steps with Sketchfab
This is how I saw that I had georeferencing issues. The track was a bit offset. I chose at the time to add textures from well known imagery providers to check georeferencing—not too hard as this is something I’ve played with for years now. The results were awesome, and I wanted to share that to the world. That’s how I started using Sketchfab:
- I could upload natively in glTF binary (.GLB)
- I could customize initial camera view and light
- I could add pretty post processing effects
- I could share on social media with nice embeds and a playable viewer
Sketchfab is awesome and I had to cope with free account limits (<50MB models) but could share nice results.
This is the first export I made after running my program locally.
File opened with ThreeJS viewer. Nice, but…
…the same model in Sketchfab with 3D settings (field of view, environment, background, material tweaking) looks gorgeous!
Mesh size improvements
I talked to Frédéric Aubin, a talented geomatic engineer/researcher, and a close friend, about how I could decimate the models, using TINs. He jumped in all the way and coded the awesome bits for TIN generation. The first results were amazing and he was very happy to contribute to an open source project and to cope with this hard problem.
- Model with native DEM resolution.
- First result with 50m TIN: a lot fewer triangles while the shape aspect is preserved.
I started to experiment and I came up with the first textured model with TIN:
TINs are computationally intensive, and parameters must be chosen carefully. We plan to release the TIN option soon on elevationapi.com, including other decimation algorithms (Quantized meshes (RTINs), optimized TIN algorithm, Google/Draco).
Going live
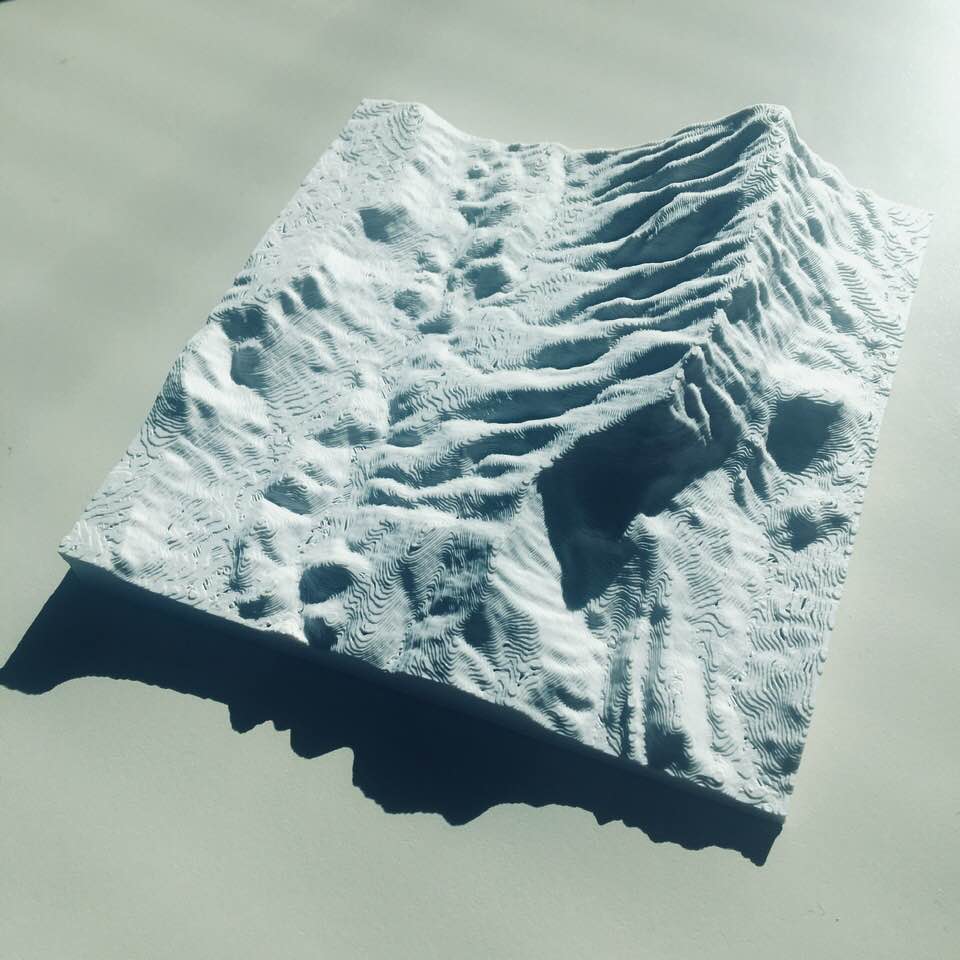
Later on, one day a friend who owns a 3D printer asked me “Can you do STL? I’d like to test my 3D printer with one of your models”. As triangulation is model-format agnostic, a few days later I integrated IxMilia’s STL bits and was doing STL. I sent him the model and the next morning I saw this on my desk:
Seeing hours of work materialized was something emotional! I was able to touch my work!
Some colleagues asked for a model of the regions where they live, and I asked them to send me a bounding box polygon in WKT format. This was like an alien idiom to their ears, so after helping them, I realized how hard this was to use the API without prior knowledge.
After googling and slacking around I realized that there were two main ways to ease access to the API: Build a CLI (Command Line Interface) tool like GDAL, or build a playground site with a WebAPI. The latter could reach 2 audiences at the same time:
- A website is user friendly
- WebAPIs are developer friendly
Moreover, I knew that going this way would challenge me, challenge the core APIs. I did not want offline processing, I wanted real time generation!
- Parsing the user bounding box
- Locating correct DEM tiles among 36,000
- Reading elevation height map
- Downloading imagery tiles, assembling them, cropping the result to a texture
- Generating normal map
- Reprojecting height map to EPSG 3857
- Triangulating
- Building a glTF model and saving it
I built the elevationapi.com website and Web API in a week in summer 2019. I wanted to do this with the newest tech bits: using ASP.Net Core and Microsoft Azure for the backend and VueJS for the front end, using SignalR to send/receive server-to-client events for generation progress.
I have moved out of the Cloud for financial and technical reasons: I couldn’t find a cheap and fast way to generate models on the fly with DEM files stored locally, and didn’t want the architecture to be tied to the cloud. The solution is self hosted on a private server with muscles, saving me thousands of dollars every year.
After publishing the site, I got thousands of visits from 160+ countries!
I then started to add every public global dataset available, interfacing with NASA Earth Data and single file datasets, now supporting HGT, ASC, GeoTIFF, netCDF as raster input format.
OpenStreetMap integration
I always wanted to integrate natural data (rivers, lakes, peaks, passes) and artificial (buildings, roads) into the models. The hard part of getting proper elevation was done, and from my previous tests (line drawings), I already had on-the-fly OSM queries.
Buildings were hard to integrate: height data is normalized in different ways and roof shapes are hard to triangulate because their shape is not known in advance, they have holes, etc. I could triangulate roofs as planes thanks to open source contributors (Bert Temme), and ran a lot of tests on different building types. There are still some bugs and lots of improvements to be made.
I wanted to insert that step into the current pipeline, for live generation. It had to be done from the website within seconds for a model, and I had to estimate OSM building count to stay behind my model size limit (75MB). Fortunately with Overpass Turbo (example), it was possible to get the building count and thus estimate the number of vertices, triangles, and vertex attributes in the model.
If buildings, why not ski slopes, colored by difficulty level ?
Collaborations
Sketchfab became my landing area, a place representative of what the API could do. I started to share models on Twitter and LinkedIn.
A lot of people didn’t understand why I was giving all this for free, why I didn’t have a business model. I tried to explain to them the philosophy that it’s based on free and open data, gave credits to the data sources I used, but started to question myself about the meaning of all this.
Was it the right way? Was it an ego-thing of showing the world what I can do, turned into charity? At the same time I felt inside me that I had to follow the same passionate track.
Suddenly I started getting direct messages from people congratulating me for the effort, and others asking for awesome new features and enhancements.
This was so encouraging, that gave me a huge energy kick!
Multimaps
Javier Jimenez Shaw reached out to test Line elevation requests for his excellent site. He helped me to point out some bugs in the API regarding DEM edge cases. After fixing this, he officially listed the API as an elevation provider for his site.
 Multimaps: the elevation profile shown here is provided by Elevation API with ASTER_GDEMV3 dataset and ran in 40ms (!)
Testimonial from Javier
Who you are: Software developer fan of maps, old and new
What you do: I have been developing a web page to display two synchronized maps at the same time, with more tools, like line and points edition, and elevation profile, among others.
Why Elevation API could be useful: It provides a fast and simple way to request the elevation of one or more points. Very useful to provide an elevation profile to the user. For instance of their last walk on the mountains, or to prepare a ride for the weekend.
What you want it to do: The current interface is enough for our needs. It’s great.
Michael Haberler
This started a fun story: Michael Haberler, an Austrian gentleman, reached out writing that GPX tracks were stuck to the ground (a few days after spending a lot of time to ensure the GPX is well georeferenced and not going through the terrain).
I answered “Yes, that’s the point, I recalculate elevations for that purpose”.
Michael said “Yes but I’m a balloon pilot and I don’t need that, my tracks are in the sky”
We are still working together now, but thanks to Michael I can read tracks and sensor data feeds in order to produce an animated GPX track programmatically via a glTF animation.
You should check out his 360° videos:
Expect more soon on that.
Pato Romero
Pato Romero needed to generate a model from my DEM sources with a custom imagery provider: I coded an easier way to add custom providers.
Testimonial
I am a Forest Engineer, from Valdivia; Chile.
I work with GIS and Remote Sensing. Traveler and amateur photographer from diverse latitudes, preferably extreme
Elevation API could be useful to assess:
- Land cover change in 3D
- Watersheds to planning process
- To teach Geomorphology
- Glaciers in mountain areas (My favorite)
- To represent routes to trail running, or research field trips such as are the case in archaeological studies.
The Virtual Library of Brazil’s Geology (BrGeo.org)
BrGeo.org produced awesome 3D scans of Brazil geologic sites, and offers free downloads on Sketchfab.
Testimonial
Who you are: The Virtual Library of Brazil’s Geology is a project developed by five Universities in Brazil. The project has several collaborators, including researchers and undergraduate and graduate students.
What you do: The Virtual Library of Brazil’s Geology is a project to build and share free virtual materials to improve teaching and research in geosciences.
Elevation API usage: Elevation API facilitates the building and sharing of digital terrain models, which can be made at several scales and resolutions. These digital terrain models are handy for training in geosciences, especially in geomorphology, structural geology, and tectonics, sedimentary geology, remote sensing, geological modeling.
Elevation API has gained attention by the Brazilian geoscience community for the fast building of digital terrain models; it’s ease to use, and flexibility.
What you want it to do: Recently, we started a cooperation with @xfisher to develop a code to integrate high-resolution 3d terrain models within the digital terrain models using Elevation API. We are very excited about this integration because it will allow anyone to gain insights on a regional to local scale, allowing us to integrate information on several levels and derived from different sources.
Other collaborations
- Anthony Kavassis was one of the firsts to reach out, we quickly became friends, and he is now part of the team, in charge of the build pipelines on Azure DevOps. Thank him for the good vibrations!
- Erika Luukas from Reiver3D needed heightmaps and normal maps as separate images, that’s why they are downloadable now on the site.
Mycenaean Atlas Project (and how I started using Sketchfab API)
Bob Consoli is the father of the Mycenaean Atlas Project. He has been a fair supporter, and is a generous sponsor of the API.
Testimonial
Xavier Fischer has been of crucial assistance in realizing the goals of the Mycenaean Atlas Project. This is a web site dedicated to mapping all the find spots associated with the Mycenaean people. A great deal of my work has been with maps and elevations. Xavier has lent invaluable assistance specifically in the following areas:
- Providing an API that will return accurate elevations from a variety of digital elevation models including some more accurate than I had previously had access to. This is useful not just for estimating the elevations of individual sites. I was able to build a display that characterized the ground around a site to determine whether the site was suitable for habitations. (Aspect)
- Providing an API call that returns intervisibility information between any two sites. Xavier went out of his way to design and implement a special graph display for this information.
- Provided more than 3950 three-dimensional terrain models for the sites in my database and which are suitable for online display. This involved many hours of work on his part; most of this uncompensated.

- Xavier is an excellent support person. On many occasions, he has gone out of his way to fully answer random questions and otherwise provide support for me in areas where I have little knowledge.
Building the Sketchfab exporter
As Sketchfab was my publishing platform, it became more and more obvious that
- Direct export from the website would be a great benefit for me and the community
- Interfacing with Sketchfab API would be great (could implement a model gallery, add viewer annotations)
I was not in a hurry to do it… until the Mycenaean Atlas Project. I needed to produce 3500 1.5km x 1.5km models and could not upload all of them manually!
Challenges
- Costs: 3500 models with 120 imagery tiles each means more than 400,000 tile requests. I did not want to cache them as it’s not allowed by tile provider’s terms. The better looking tiles were found on ThunderForest and Bob acquired a one month plan to go above the 150K free-plan threshold.
- Upload with all attributes (environment, annotations, camera, name, description, categories and tags)
- Add OSM buildings on every map model
- Annotate every Mycenaean site on the model map
- Find an environment (lighting) that could work for any model
- Allow download of models under CC license
- Uniquely identify the models to enable a backtrack to the Mycenaean site identifier
- Upload to a dedicated Sketchfab account
Outcomes
I wrote to Sketchfab (Thomas Flynn) about the project and Sketchfab kindly elevated us to a Pro account for this usage. I started to make some tests with Postman, ported the API calls to C# (not that easy), and tried to handle errors correctly.
Sketchfab API was easy to use once I understood the modalities.
There were some complications: the Data API does not accommodate tweaks to the 3D settings (post processing effects, annotations).
I asked on the Sketchfab forums and finally adapted a Viewer API sample and saw that the missing features could be done via the Viewer API. All nearby sites could be annotated as well, using a neighborhood query and reprojection to model coordinates.
Bob Consoli integrated the viewer API so that he could annotate every site found within the 1.5 km range.
We had our workflow.
All model generation and uploads were done within 4 days, tweaking sleep intervals between uploads to 30s to avoid “Too many requests” errors from the Sketchfab API.
I also added automatic attributions inside the description, and a backtrack link to the Mycenaean Atlas.
The upload code has been made public here, albeit not fully documented yet.
We then had a problem: I tagged and categorized all the models, so this had the annoying side effect of cluttering the Sketchfab UI for many Sketchfab users. I made the decision to remove all categories and tags except non-intrusive ones, and had to update the Sketchfab C# API for that purpose (get models, fetch through the pages, check if model was already updated, update it).
All models are now properly tagged and categorized, without disturbing the experience for other users.
That’s how SketchfabApi.Net was born!
Building the exporter
I had the basic code bricks to build an elevationapi.com Sketchfab exporter. I had to carefully choose which OAuth2 flow to use.
As the models are generated on the API back end, I did not want the user to do the upload (50MB is a huge payload), but rather send an export request to the API, and let the API do the upload, then benefit from the backend bandwidth. (50MB uploads take less than a few seconds)
MVP / Key requirements
- Upload from elevation API backend to the user’s account
- Transparently add third party attributions and “elevationapi” tag
- Set default license and environment
- Add to a predefined “Community” collection on my @xfischer account after model is published
How it works
- Every model generated is sent to the client with an “Asset Information” payload and a unique request origin identifier.
- This same payload is stored in a dedicated cache on the server side upon generation.
- When a user clicks “SketchFab export”, an authentication request is made to Sketchfab, passing along the request identifier which is later retrieved when authentication succeeds (typical OAuth2 flow).
- The user fills in the model name, description and usual attributes recommended by the Sketchfab guidelines, and launches the upload.
- The model is not sent—only the typed attributes, request id and user’s token are sent to the API, which retrieves the asset info and makes the Sketchfab Data API upload call using the SketchfabApi.net library.
- The model may take time to be processed, or the user may not publish it immediately, tweaking 3D settings first (I recommend doing that!). So the API is checking on a regular basis and for a given time the processing state, and when the model is processed+published+public, it is added to the Community collection.
Tools used
Computer: MacBook Pro 13 / Parallels VM on Windows 10
Tooling: Visual Studio 2019, Visual Studio for Mac, VS Code, JetBrains Rider (not used lately)
Environments:
- .Net Core for the library and the samples
- Asp Net Core 3.1 for the Web API
- Front end : VueJS / Buefy / Leaflet
Third party libraries are listed here. Thanks to all the people behind those libraries.
Last words
Contributions to DEM Net Elevation API are welcome!
Any prior usage of the Web API requires acceptance and CORS clearance. The service will remain free as long as I can afford it.
Twitter / GitHub / LinkedIn / Mail
