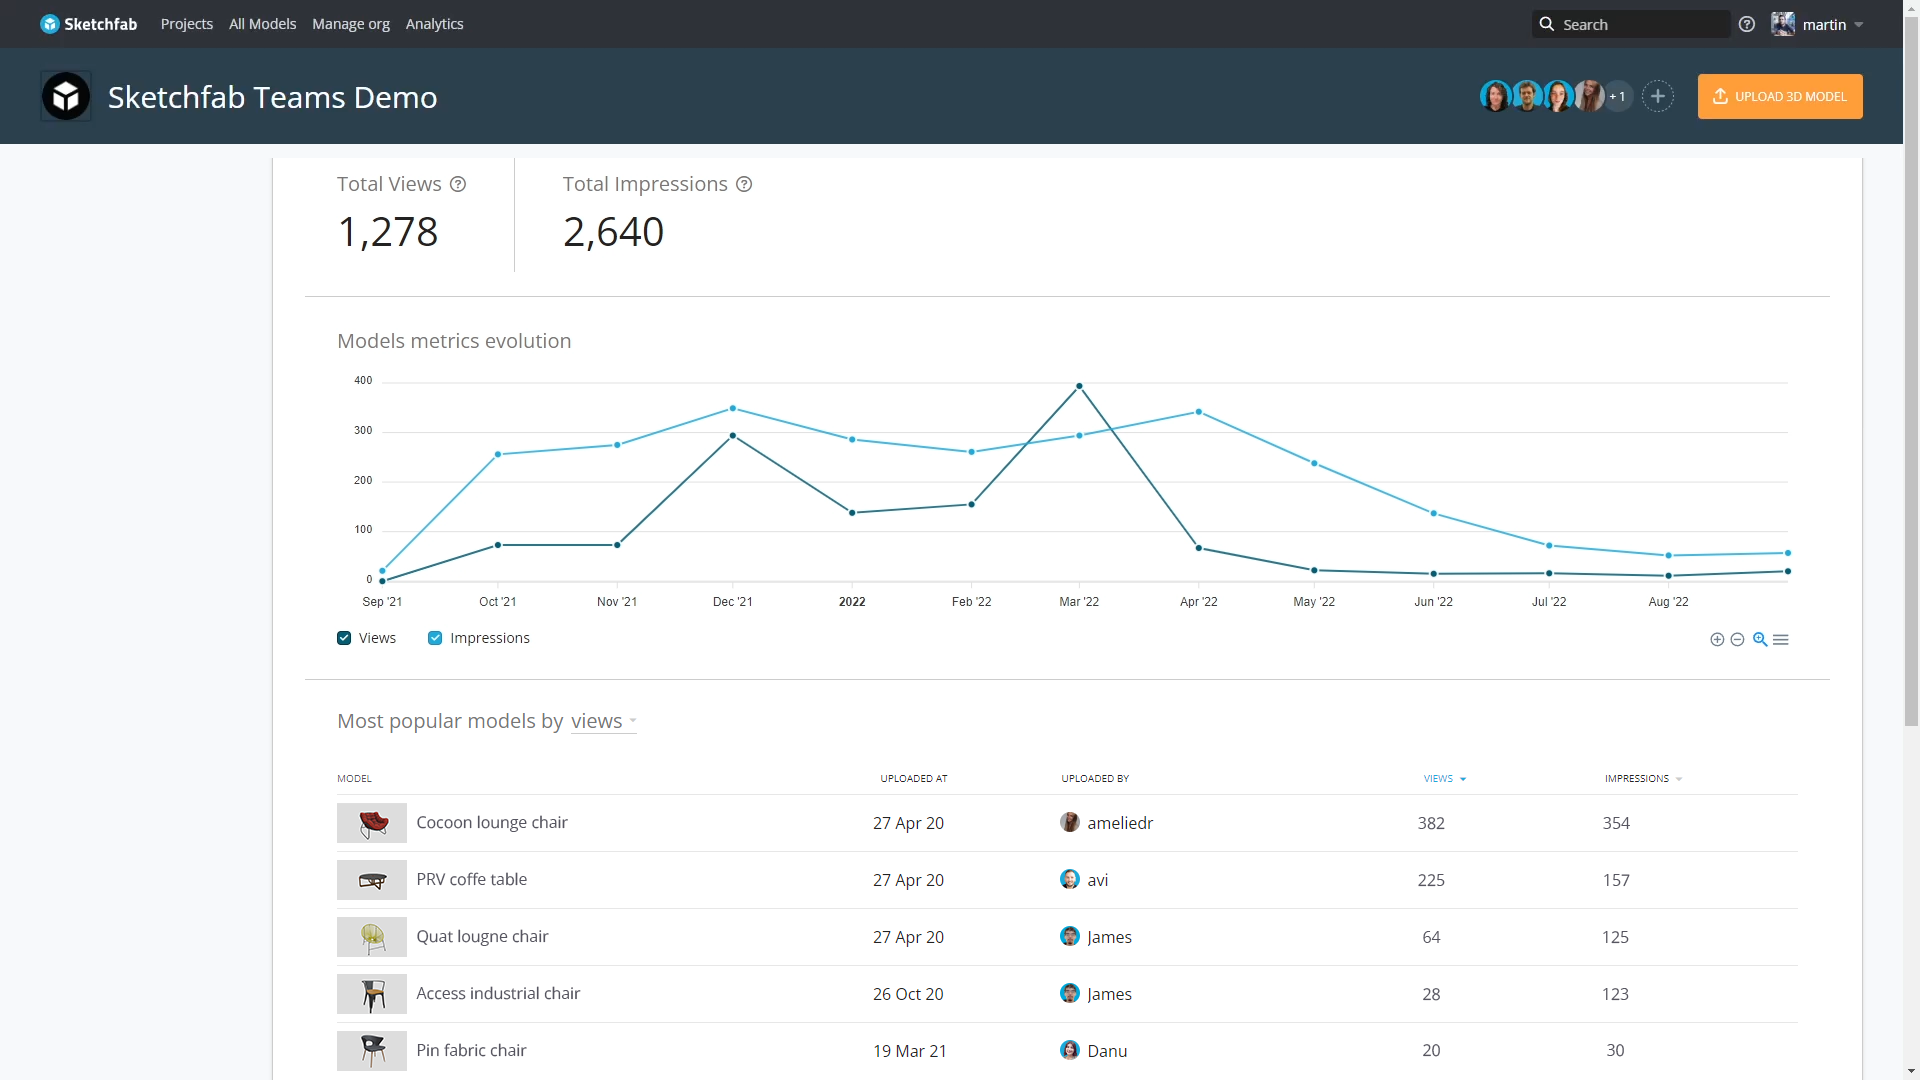
You asked for it and now it’s here. Today we’re excited to launch a beta version of Analytics in Sketchfab for Teams.
Sketchfab for Teams is our robust 3D content management system built to help creative teams collaborate easily on 3D projects. Now, with the beta Analytics feature, teams have access to detailed data on how their 3D projects are performing. They can access model views and impressions to better understand when and where their models are being seen and interacted with.
Analytics is currently available to Premium and Enterprise subscribers who are using Sketchfab for Teams.
Sketchfab Analytics offers detailed content insights
Our Analytics feature lets you see and evaluate both big-picture organization-level data as well as more fine-grained model-level data. Access to performance data varies by role:
- Admins can view all analytics data, both Overview and Models dashboards.
- Contributors can view Models dashboards for models to which they have access. They do not have access to the Overview dashboard.
- Spectators cannot view any analytics data.
The Analytics Overview dashboard displays data for your account as a whole. Here you can see trends over time, easily identify which of your models has received the most views and impressions, locate the countries that are seeing your content, and pinpoint which web domains are driving model traffic.
For a closer look at the performance of individual models, switch to the Models dashboard or click the analytics button on the model page. This is where you can explore the views, impressions, and traffic sources for each model in your Teams account.
Filter and sort to drill down data
In both overview and model views, you can filter your data by time period and either country or domain. Want to see how many views your model had from the United States in the past 3 months? Just select the ‘Last 90 days’ preset from the date dropdown, and then filter by ‘Country’ and ‘United States’.
Want to learn what the most viewed model was? Either select ‘views’ from the dropdown above the data table, or click on the ‘VIEWS’ column header to sort by views.
Want to learn more?
To learn more about Analytics in Sketchfab for Teams, the difference between Views and Impressions, and more, head over to the Help Center. And if you are interested in upgrading your account to Premium in order to take advantage of all that Sketchfab for Teams has to offer, check out our Plans page.


