My name is Phil Wilkes, I am a postdoc in the Department of Geography at University College London (UCL), and part of my role is to create 3D models of trees from terrestrial LiDAR data. We do this to measure a tree’s biophysical properties, such as mass of sequestered carbon or surface area of leaves. These metrics are important for assessing the capability of the world’s forest to mitigate climate change and for modeling future climate scenarios.
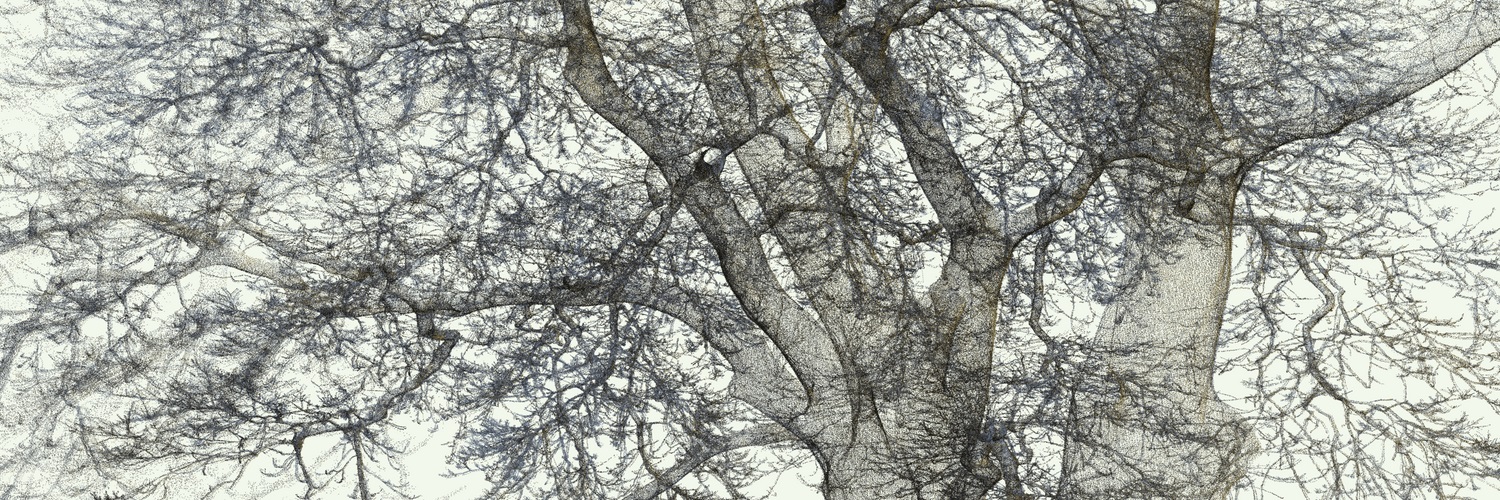
If the opportunity arises, the UCL team also captures large and unusual trees, such as the Hardy Tree in Camden, London. On a recent field trip to Australia we were staying near the small town of Yungaburra, an hour inland from Cairns. Just outside the town is the Curtain Fig Tree, a magnificent 500 year old strangler fig. The tree has a very unusual aerial room system caused by the host tree falling into its neighbour. Although the tree was fairly easy to capture – there is a walkway surrounding the tree – the tree’s unusual structure will require some time and post-processing to estimate its mass!
https://skfb.ly/6BKZy
Over the last couple of years we have scanned everything from whole forest plots to individual branches, as well as back gardens and historic glass houses. The highly accurate, millimetre level measurements acquired with a terrestrial LiDAR allow us to take measurements that would be very difficult and potentially destructive to measure using more traditional methods such as with a tape measure. The techniques we use have been developed in tropical forests over the past 5 years, and recently we have applied our approach to urban trees in and around London revealing pockets of forest that have very high biomass. We have also teamed up with the arboretum team at Kew Gardens, home of the most diverse botanical collection in the world, scanning some of their remarkable trees.
https://skfb.ly/6vWMU
https://skfb.ly/6vZ6V
To capture a single tree we use a RIEGL VZ-400 coupled with an Nikon DSLR camera, which allows each point to be attributed with a colour. The number of scans per model depends on the size of the tree. There are typically 5 – 8 different positions, and at each position an upright and tilt scan is captured to compensate for the scanner panoramic field of view. Scans are linked to each other using retro-reflective targets (small cylinders covered in 3M reflective tape) and coregistration is completed using RIEGL’s RiSCAN Pro software (see here for more details). Once scans are combined I then use CloudCompare and a Python workflow to clip surrounding trees, reduce point density, colour points, etc. After uploading to Sketchfab (usually as a .ply to reduce file size), I reduce the point size in 3D settings as point density can be high and this allows details to be clearly seen, pick a neutral background colour and stick it on my Twitter feed.
LiDAR data can be very visually engaging, but up until recently, sharing these data with non-technical colleagues has been difficult. Sketchfab allows us to share and demonstrate our work with anyone who will listen, often crowding around a smart phone at a conference! I first discovered Sketchfab on Twitter when I saw this fantastic model of a tree stump, and I now spend many hours down a Sketchfab rabbit hole looking at everything from cars to beached whales.


